
Humanoid Robot Shipments Top 22,000, Yet Factory Use Lags [Update]
Humanoid robot shipments passed 22,000 in H1 2026, but entertainment and data roles still dominate the mix. Here is what that means for buyers and investors.
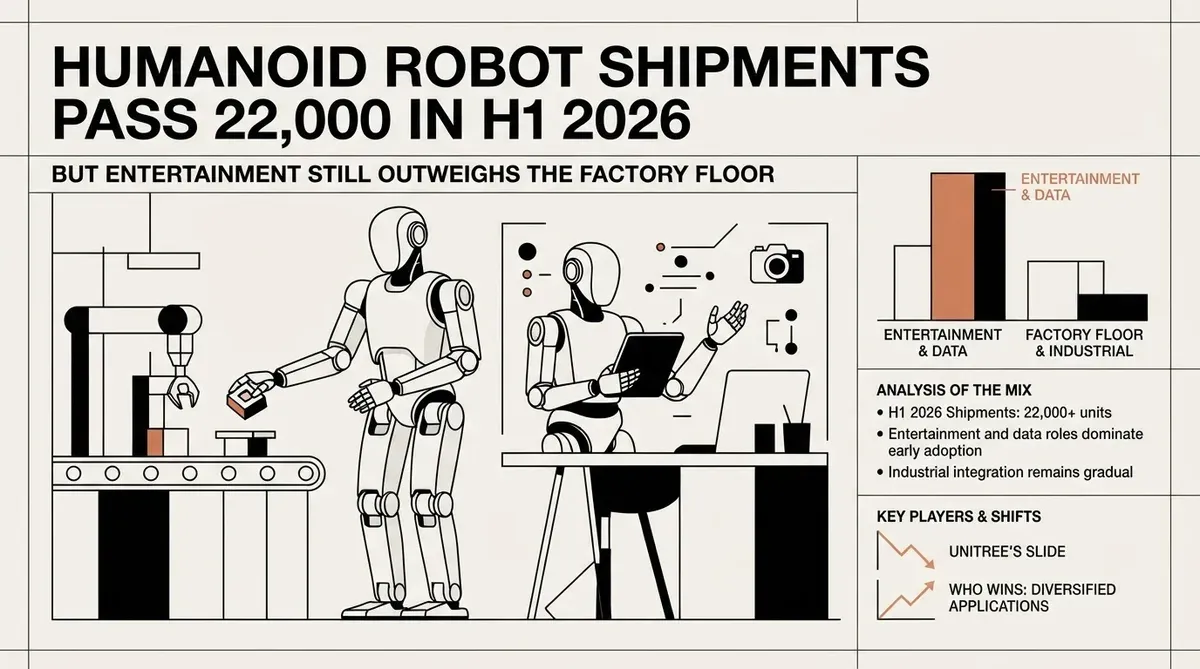
Counterpoint Research's first tracker of global humanoid robot shipments records more than 22,000 units delivered in the first half of 2026, up nearly 300% year on year. Released August 20, the report offers the clearest breakdown yet of where those machines actually go. The mix shows entertainment and data collection absorbing the majority of volume, with manufacturing and logistics under 18% combined.
The new numbers extend the picture from Smart Analytics Global's August 10 estimate, which we covered in our earlier analysis: 19,100 units in the same six-month window, up 272% from 5,100 in H1 2025. Counterpoint's independent tally lands roughly 15% higher, while China's Humanoid Robot Scene Application Alliance claims Chinese makers alone shipped more than 30,000 units in the period. Three methodologies produce three different humanoid robot shipments estimates. All point in one direction.
Humanoid Robot Shipments: Three Estimates, One Trend
The gap between the three figures is partly methodological. Smart Analytics Global counts units shipped to customers rather than units in service, and its 97% China share suggests it tracks the Chinese channel most closely; the alliance reports only domestic vendors, which makes its 30,000-unit claim compatible with either global estimate. Counterpoint's 22,000-plus sits between the conservative and aggressive reads. All three trackers of humanoid robot shipments agree on the trajectory: the category has more than tripled in a year. That spread also matters for forecasting, because a 15% difference in the denominator shifts full-year projections by thousands of units and changes how procurement teams should compare vendors.
The vendor rankings for humanoid robot shipments are where the independent trackers fully agree. AgiBot leads with roughly 9,700 units and more than 43% share; Unitree is second at about 7,000 units and 31%. Galbot, UBTECH, and Leju Robotics complete a top five that holds 86% of global shipments, with every slot filled by a Chinese company. That matches Smart Analytics Global's finding that China supplies more than 97% of the market and absorbs roughly 85% of demand, a two-sided dominance with no equivalent in any other robotics category.
The ranking also confirms the leadership change we covered last month: AgiBot has overtaken Unitree as the volume leader. Unitree remains the world's largest maker of robot dogs and the second-largest humanoid producer, but its shipment lead is gone, and the stock market's reaction suggests investors now weigh what units earn rather than how many ship.
The Application Mix Tells the Real Story
Counterpoint's application breakdown for humanoid robot shipments is the report's most important addition. Entertainment and performance work claims 33.6% of first-half shipments, data production and research 27%, and service guidance roughly 19%. Smart manufacturing takes 12.8%, while warehousing and logistics account for 4.9%.
| Application | Share of H1 2026 shipments |
|---|---|
| Entertainment & performance | 33.6% |
| Data production & research | 27.0% |
| Service guidance | ~19% |
| Smart manufacturing | 12.8% |
| Warehousing & logistics | 4.9% |
Read together, more than six in ten humanoids shipped went to audiences, exhibits, and labs rather than production environments. Entertainment machines are largely one-off purchases for museums, shopping complexes, brand launches, and trade shows; data-production units feed research programs. Neither creates the recurring service revenue of a deployed fleet. Uptime contracts, maintenance, and software updates are where robotics economics get built.
Service guidance, at roughly 19%, is the segment that blurs the line: tour guides and education units earn more than a performance robot but far less than a production asset, and how a research firm classifies them explains much of the divergence between Counterpoint and Smart Analytics Global. Counterpoint counts them separately from industrial use, while Smart Analytics Global's commercial bucket, which it puts at more than 70% of shipments and up from about 50% a year earlier, appears to fold them in. Counterpoint also notes the combined share of entertainment, performance, and data-collection units declined only moderately during the half. That is movement in the right direction, but from a small industrial base. Buyers should read shipment totals together with the mix, not in isolation.
Why the Stock Market Is Pricing in the Gap
Unitree's post-IPO slide shows what public markets make of volume without industrial revenue. The company's shares have fallen 45% since its listing, a decline that has revived the debate over whether robot hype ran ahead of fundamentals. The comparison is stark: shipments up roughly 300% year on year, share price down 45%, with the slide arriving in the middle of the category's strongest growth period. That makes the sell-off a statement about unit economics rather than demand.
Unitree shipped more than 7,000 humanoids in the first half, the second-largest volume in the world, and still trades below its listing price. The market is punishing the composition of those shipments. If most units land in low-margin entertainment, demonstration, and data roles, volume alone does not justify a hardware valuation premium. The vendors that attach service contracts and fleet operations to their deliveries are the ones whose revenue quality can support the multiple.
What to Watch
The forecasts frame the stakes. Counterpoint expects full-year humanoid robot shipments to exceed 50,000 units, up 210% year on year; Smart Analytics Global projects around 60,000 for 2026, with annual volume approaching 500,000 by 2030 and industry revenue of roughly $1.6 billion this year. The two outlooks also imply very different second halves: Counterpoint's full-year call needs about 28,000 units in H2, a modest step up, while Smart Analytics Global's requires roughly 41,000, more than double the first-half pace. At the projected $1.6 billion in 2026 revenue, average revenue per unit lands near $27,000, a figure that shows how much value must still come from services rather than hardware margins.
Policy tailwinds compound the Chinese concentration. Domestic supply-chain depth, new tariff codes, export-insurance policies, and government programs funding real-scenario training all push Chinese vendors ahead on volume, the same structural advantages behind the 97% supply share. With China absorbing roughly 85% of demand, most volume is domestic-first, and the international market remains a secondary channel for every top-five vendor. Those advantages apply to manufacturing output; recurring-revenue businesses are a different contest, which is why the industrial mix is the metric that separates leaders from the rest.
For decision-makers, the practical read is straightforward. Shipment counts are adoption proxies; the application mix is the leading indicator. The winners will be the vendors that convert shipped units into recurring industrial revenue through service agreements and fleet operations, and the full-year 2026 data will show whether the factory floor finally overtakes the showroom. The useful question is how many units earn their keep in continuous operations, where service contracts, spare-part flows, and software subscriptions compound.
Why this matters
Humanoid robot shipments now run at a scale that demands serious evaluation, but the mix shows the industrial transition is still in its early stages. Buyers and investors should weigh application composition over headline volume, because that is what determines which vendors build durable revenue. The full-year 2026 report, and whether the factory share finally moves, is the milestone that settles the question.
AI-generated image.
Related Articles
- Humanoid Robot Shipments Jump 272% as AgiBot Overtakes Unitree in China-Dominated Market
- Hyundai's Atlas Humanoid Robots: The Unit Economics of a 25,000-Unit Factory Fleet
- Humanoid Becomes Europe's First Humanoid Robotics Unicorn with $152M Series A
✔Human Verified
Researched and cross-referenced against primary sources by the Bytevyte editorial team. This article was generated with the assistance of artificial intelligence and reviewed by the Bytevyte editorial team.